- Anubhav Sarker
- Published: 09/19/2025
- Last Updated: 11/02/2026
Why customer success metrics matter
In SaaS Capital's 2025 survey of more than 1,000 private B2B software companies, median gross revenue retention for 2024 was 91%, and median net revenue retention, which counts upsells, was 101%. Those medians describe the same companies and year. The gap between them is why I distrust any customer success dashboard that uses a single retention figure.
Each of the 12 metrics below gets a formula, an illustrative calculation, and the decision it informs. The illustrative numbers are arithmetic examples, and none is a benchmark.
Customer success metrics measure whether customers reach the outcomes they paid for
Customer success metrics measure whether customers achieve meaningful outcomes and continue to receive value from what they bought. Logins, emails sent, fast replies, and completed onboarding tasks only prove that work happened, which is a separate question from whether the customer got what they came for.
Customer outcomes are things the customer would recognize as progress, such as an agreed onboarding milestone. Relationship and commercial outcomes come afterward, such as renewal and retained revenue. Diagnostic signals, such as survey scores and support performance, help explain why the first two moved.
A metric becomes a KPI when your team selects it to judge a specific objective and names who must act on the result. Churn rate becomes a customer success KPI when your operations lead owns the quarterly figure and explains each lost account.
Sales measures such as win rate belong to acquisition; our sales rep performance metrics guide covers them.
Retention metrics show whether existing customers stay
Customer churn rate measures losses from your starting customer base.
Churn rate is the share of customers you had at the start of a period who were gone by the end. Customers who arrive during the period are excluded. Define "lost" first: a cancellation that took effect in the period, or, where customers buy occasionally, no purchase for a set number of days, a rule that fails when customers buy once a year.
Formula: customers lost during the period ÷ customers at the start of the period × 100.
Illustrative calculation, one quarter: 250 customers on day one, 15 lost by the last day. 15 ÷ 250 × 100 = 6%.
Retention rate is the complement, 94% here, only when it uses the same population, period, and definition of lost. Read the list of 15 before the 6%; the list says who to call.
Renewal rate measures the percentage of eligible contracts that renew.
Renewal rate applies to contracts with a defined end date. The denominator is contracts due for renewal in the period rather than all customers, and you should say whether you count contracts, accounts, or renewed dollars.
Formula: contracts renewed ÷ contracts due for renewal in the period × 100.
Illustrative calculation, contracts: 40 were due in the quarter and 34 renewed. 34 ÷ 40 × 100 = 85%.
Decide before the first report how to treat late renewals, then record a reason for each of the six that did not renew.
Revenue retention shows what happens to existing customer revenue
Both measures use a single opening cohort: every customer who pays at the start of the period, along with their recurring revenue at that time. Use monthly recurring revenue (MRR) or annual recurring revenue (ARR) consistently. New customers' revenue is excluded, and I report reactivated customers on their own line rather than as expansion.
Gross revenue retention excludes expansion revenue.
GRR shows how much of the opening revenue survived cancellations and downgrades. It cannot exceed 100%.
Formula: (opening recurring revenue − churned recurring revenue − contraction) ÷ opening recurring revenue × 100.
Illustrative inputs for one quarter, shared by both measures: opening cohort MRR $20,000; cancellations $1,200; downgrades $800; upgrades by the same cohort $2,500.
GRR: ($20,000 − $1,200 − $800) ÷ $20,000 × 100 = $18,000 ÷ $20,000 × 100 = 90%.
So 10% of the opening revenue is gone, and the two loss lines indicate whether to work on saving accounts or to stop downgrades.
Net revenue retention includes expansion from existing customers.
NRR adds expansion from the same cohort, so it can exceed 100%.
Formula: (opening recurring revenue − churned recurring revenue − contraction + expansion) ÷ opening recurring revenue × 100.
NRR with the same inputs: ($20,000 − $1,200 − $800 + $2,500) ÷ $20,000 × 100 = $20,500 ÷ $20,000 × 100 = 102.5%.
An NRR above 100% means expansion exceeded losses inside that cohort, which is a mathematical reading rather than a target. GRR belongs beside it because here a few upgrades hide $2,000 of lost revenue. The SaaS Capital medians from the introduction, 101% NRR and 91% GRR, are self-reported figures gathered by a lender to that market, mostly from software companies above $1 million in annual revenue, and they say little about a consulting firm or a retailer.
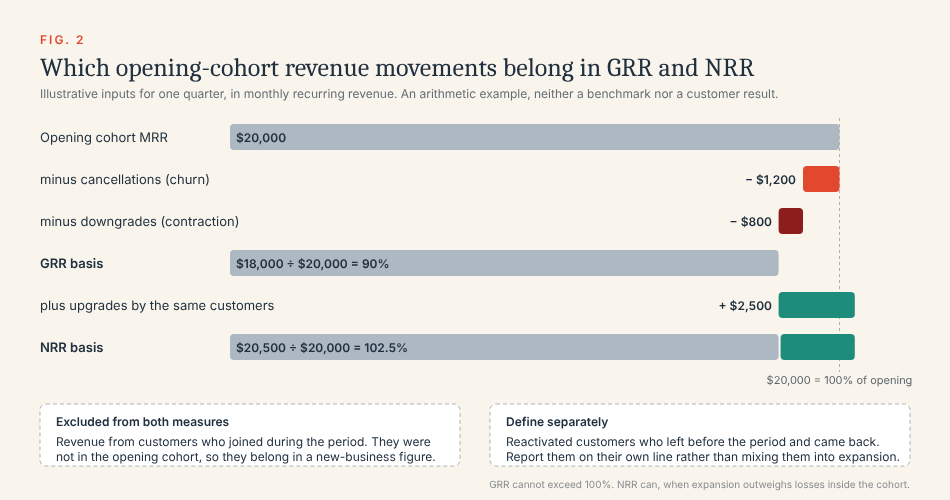
GRR removes churn and contraction from the opening cohort’s revenue, and NRR adds back expansion from the same customers.
Satisfaction metrics record what responding customers say
Both scores describe the people who answered, rarely everyone, so compare response counts and respondent mix before comparing periods; a higher score from different customers is not improvement. Keep wording and send timing fixed.
NPS measures respondents' willingness to recommend your business.
The Net Promoter Score comes from one question, "How likely are you to recommend us to a friend or colleague?", on a 0 to 10 scale. Scores of 9 and 10 are promoters, 7 and 8 are passives, and 0 to 6 are detractors. Frederick Reichheld introduced it in Harvard Business Review in December 2003.
Formula: (promoters ÷ all valid respondents × 100) − (detractors ÷ all valid respondents × 100). Passives stay in the denominator. Report the result as a score from −100 to 100 rather than as a percentage.
Illustrative calculation: 120 valid responses: 54 promoters, 42 passives, 24 detractors. Promoters are 45% and detractors 20%, so NPS = 45 − 20 = 25.
With 120 responses, a few changed answers move the score several points, so read the 24 detractor responses and call anyone who left a comment.
CSAT measures satisfaction with a defined experience.
A customer satisfaction score asks about one specific experience, such as a support interaction, soon afterward. Set the scale and decide which responses count as satisfied before you collect anything. On a 1-to-5 scale, common choices are 4 and 5.
Formula: satisfied responses ÷ all valid responses × 100.
Illustrative calculation: 80 valid post-support responses, 62 of them a 4 or 5. 62 ÷ 80 × 100 = 77.5%.
CSAT describes one interaction rather than the whole relationship, so use it to find which interaction type draws the low scores.
Service metrics help explain friction in the customer experience
First response time measures how long customers wait for an answer.
The clock starts when the request arrives and stops at the first substantive reply from a person. An automatic acknowledgment does not stop it. Say whether you count elapsed or working hours.
Average formula: sum of first response times ÷ requests that received a first response in the period.
Illustrative calculation, working minutes for five requests: 12, 25, 40, 55, and 300. Average: 432 ÷ 5 = 86.4 minutes. Median: 40 minutes.
One slow reply doubled the average. Queues are usually skewed like this, so report the median for the typical experience and a high percentile, such as the 90th, for the worst cases.
Resolution time measures how long an issue remains open.
The clock starts when the issue is logged and stops when the customer confirms the fix, or after a set number of days with no reply. Say whether you pause it while waiting on the customer, and restart it when an issue reopens.
Average formula: sum of resolution times for issues resolved in the period ÷ issues resolved in the period.
Illustrative calculation, elapsed working hours for six issues resolved in a week: 2, 3, 4, 6, 9, and 30. Average: 54 ÷ 6 = 9 hours. Median: 5 hours. Four more issues were still open at week's end, and that count belongs in the report.
First contact resolution measures the percentage of issues solved without another contact.
Eligible issues are usually those a customer raised and your team closed in the period. An issue fails first contact resolution if the customer contacts you again about it within a set window, or if it is reopened.
Formula: eligible issues resolved on first contact ÷ all eligible issues × 100.
Illustrative calculation: 150 eligible issues closed in a month, 105 with no repeat contact within seven days. 105 ÷ 150 × 100 = 70%.
The 45 repeat contacts show which closed tickets were not solved problems. Group them by issue type; a few types usually explain most repeats.
Customer effort score measures how easy the experience felt.
Matthew Dixon, Karen Freeman, and Nicholas Toman introduced the customer effort score in the Harvard Business Review in July 2010, using a 1-to-5 effort scale, with lower scores indicating better performance. A later version asks customers to rate agreement with "The company made it easy to handle my issue" on a 1 to 7 scale, where higher means easier. Scores on different scales cannot be compared, so state which you use.
Average formula: sum of valid scores ÷ valid responses.
Illustrative calculation, seven-point scale: 50 valid responses totaling 280 points. 280 ÷ 50 = 5.6.
A low average is a reason to count the steps a customer takes to reach you and remove one.
Your customer success dashboard should connect onboarding to later outcomes
A task checklist shows that onboarding work was done, which is a different thing from reaching value. These two measures track the milestone the customer cares about.
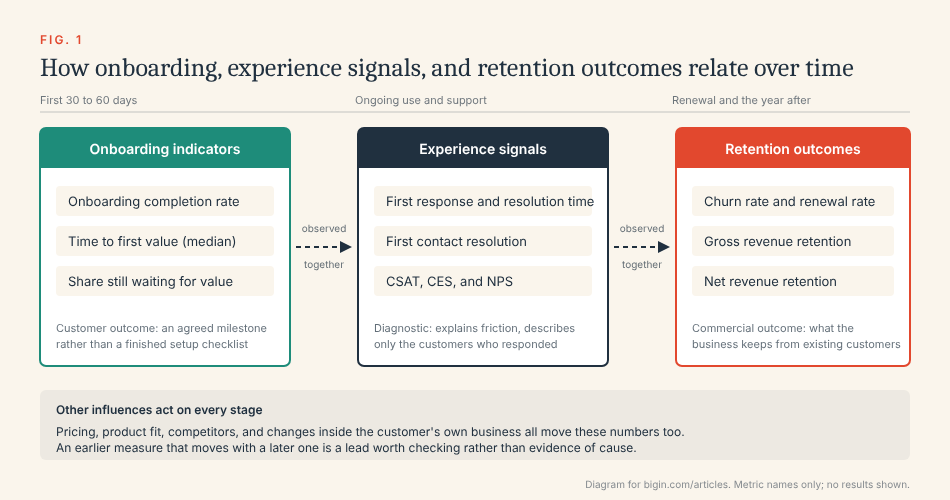
Onboarding indicators, experience signals, and retention outcomes tend to move together, which does not prove causation
Onboarding completion rate measures progress against an agreed milestone.
The starting cohort is customers who signed in a given period. Completion is a milestone you agreed with the customer, such as the first job they run on their own. The observation window is fixed, such as 30 days from the signing date. Customers whose window has not ended are not in the cohort yet; they are not failures.
Formula: customers in the cohort who reached the milestone within the window ÷ customers in the cohort × 100.
Illustrative calculation: 30 customers signed in March, and 24 reached the agreed milestone within 30 days. 24 ÷ 30 × 100 = 80%.
Then check whether the six stalled at the same step.
Time to first value measures the time until customers reach a meaningful outcome.
The start event is usually the signing date. The value event is the same agreed milestone rather than the last setup task.
Formula: value event date − start event date, in days, reported as the median across customers who reached value.
Illustrative calculation: three customers reached the milestone 9, 14, and 22 days after signing, so the median is 14 days and the average is 15.
Report the share still waiting beside the median: in the cohort above, six of 30 customers, or 20%, had not reached value at day 30. Otherwise slow and unsuccessful customers disappear from the chart.
A small dashboard needs three measures and a next action for each.
Pick one outcome measure, one onboarding indicator, and one diagnostic signal, with the same fields for each.
Role | Measure | Period and cohort | Current result | Comparison | Sample shown | Owner and next action |
|---|---|---|---|---|---|---|
Outcome | Renewal rate | Contracts due this quarter | This quarter's rate | Same quarter last year | Contracts due | Account owner logs reasons for non-renewals |
Onboarding | Onboarding completion rate | Last month's signups, 30-day window | This cohort's rate | Previous month's cohort | Customers in cohort | Onboarding lead reviews stalled customers |
Diagnostic | Median first response time | Requests received this month | This month's median | Previous month | Requests received | Support lead adjusts coverage for slow hours |
Leave composite health scores off until you can explain every input.
Compare results with your own baseline before you reach for a benchmark
Most published benchmarks for these metrics are undated, unsourced, or drawn from software companies far larger than a small business, and even the SaaS Capital figures above describe private B2B SaaS. Annual and monthly retention are not interchangeable, and multiplying monthly churn by 12 does not give an annual rate; follow a 12-month cohort instead.
When no suitable benchmark exists, say so, and compare each metric with your own result a period earlier, with commitments made to customers, and with a matched cohort. Survey scores describe the present; they do not predict churn until your own data says so.
Keep the tracking in one CRM and know which numbers need other systems
All of this depends on a single customer record with a stable identifier, contract start and renewal dates, an owner, the agreed-upon onboarding milestone and its date, and a reason code for when the customer leaves. In Bigin's paid editions, these are custom fields on the Contact, Company, or Deal record: 10 per module on Express, 25 on Premier, and 50 on Bigin 360, per Bigin's help documentation in November 2026. Onboarding fits a separate pipeline, and Premier's stage transition rules can require fields before a record moves; Vezeeta, a healthcare platform across the Middle East and Africa and far larger than a small business, runs a dedicated pharmacy onboarding pipeline this way, though its story reports no onboarding or retention figures.
Bigin's dashboards offer charts, KPI components with a duration and a comparison indicator, and target meters on Premier and above. The Zoho Desk integration, available on all editions, adds a Tickets tab to contact, company, and deal records; response and resolution times stay in Desk. Billing systems connect via Zoho Books, Zoho Invoice, or QuickBooks integrations on Express and above; survey responses reach a field via Zoho Forms or Zapier (both on the free edition) or by manual entry.
Bigin's documentation describes no native calculation of GRR, NRR, NPS, time-to-value cohorts, or response time percentiles. Those need exported billing or support figures, or Zoho Analytics, a separate Zoho product that syncs Bigin modules on a schedule and supports formulas and blended sources. Natively, Bigin shows counts: renewal records by outcome, onboarding deals by stage, and the tickets attached to each customer. Start there and calculate GRR and NRR monthly from billing.
Start with three measures in Bigin and add the rest when you need them.
The fastest useful step is one onboarding pipeline and the fields listed above. Bigin has a free edition for one user with a single pipeline, and paid editions start at $7 per user per month, billed yearly, per the pricing page in November 2026. Run the three-measure dashboard for one quarter, then decide which other metrics you need.