- Anubhav Sarker
- Published: 02/03/2026
- Last Updated: 08/28/2026
What does KPI mean in sales?
KPI is short for key performance indicator. A sales KPI is a number that tells you whether the sales side of the business is on track for a goal you have named, over a period you have named. The goal is usually revenue. The period is usually a month, a quarter, or a year.
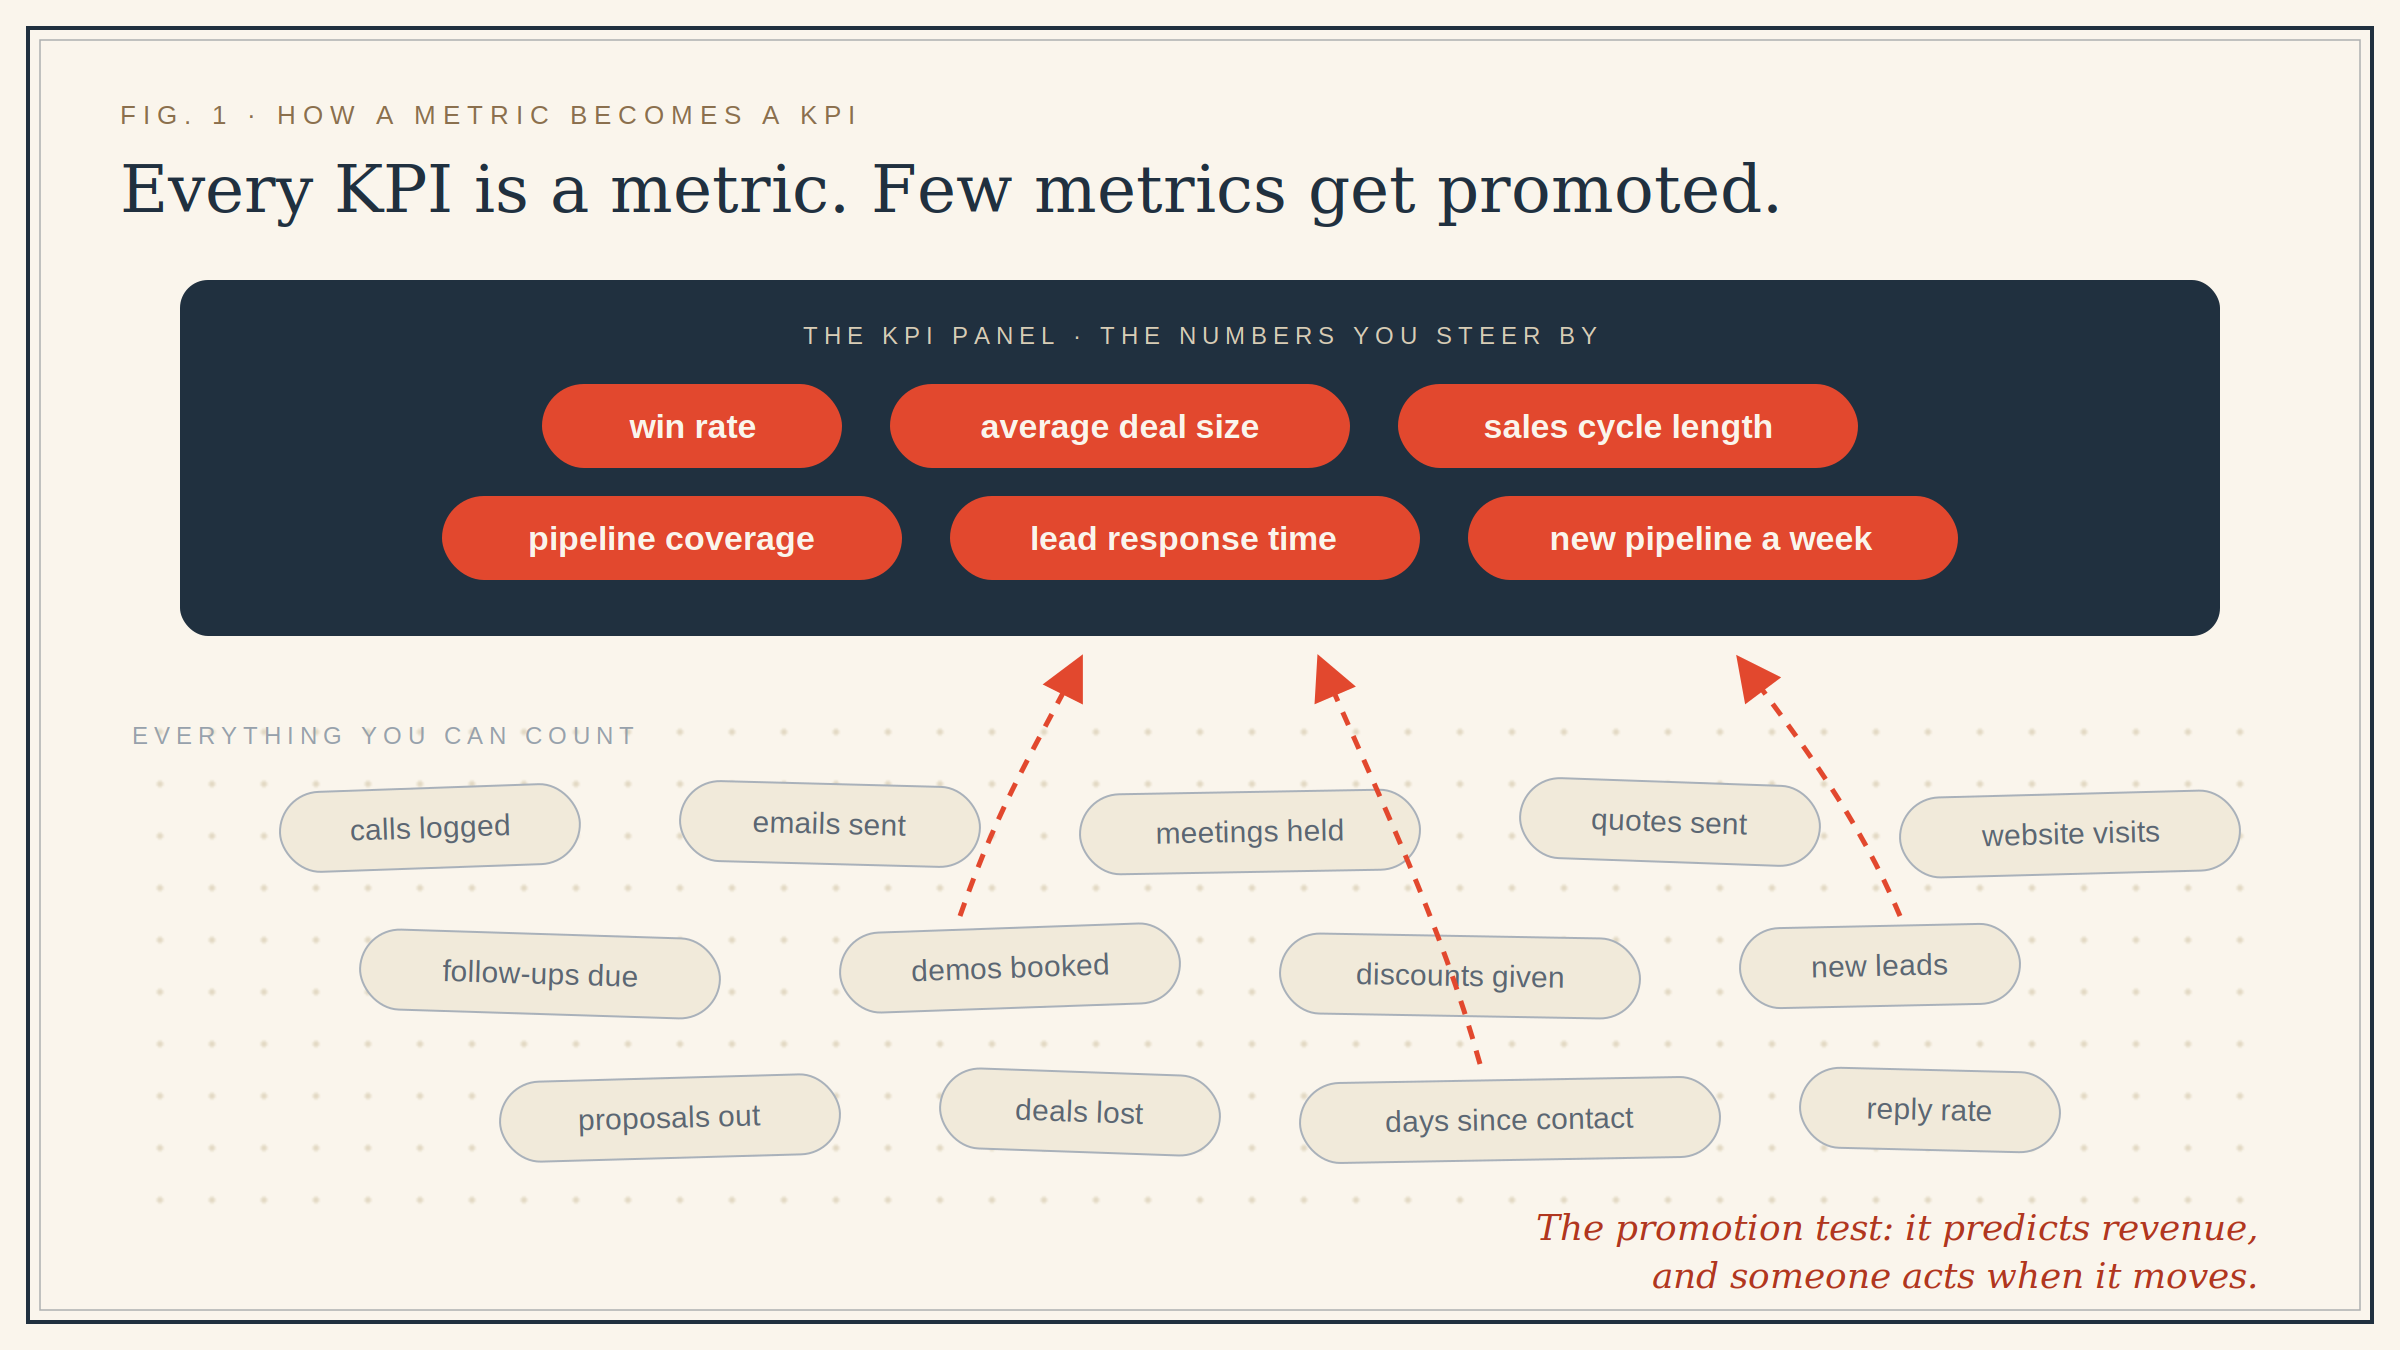
The word doing the work is "key." Everything a sales team does can be counted: calls, emails, meetings, quotes, demos, discounts, deals, and days. A KPI is one of the few metrics you have chosen to steer by, the way a pilot steers by airspeed and altitude instead of by all 200 instruments in the cockpit.
Choosing is the whole discipline, and it is harder than tracking. Enterprise sales teams hire analysts to do it. If you run a five-person business, you are the analyst, which is why most writing on this subject reads as if it were written for someone else. It was. This article assumes no RevOps function, no enablement team, no analyst, and no patience for dashboards nobody opens.
A KPI is a metric with a job
Every KPI is a metric. Very few metrics deserve to become KPIs.
A metric is anything you can measure. Calls logged this week are a metric. It becomes a KPI only when two things are true: the number predicts revenue in your business, and someone will change what they do when it changes. A wholesale distributor whose orders come from 40 phone conversations a week should treat call volume as a KPI. A design studio that wins work through referrals should not, even though both can count calls.
The test I use: imagine the number moves 20% next week, then ask whether anyone would do anything differently on Monday. If nobody would, it is reporting, and it belongs in a monthly review. If someone would, it is a KPI, and it belongs where the team sees it daily.
Leading and lagging indicators in sales
Sales KPIs are split into verdicts and predictions. Lagging indicators are verdicts: revenue closed, win rate, and average deal size. They are accurate and late. By the time monthly revenue dips, the mistake that caused the dip is one or two sales cycles old.
Leading indicators are predictions: new opportunities created this week, meetings booked, and the speed of your first reply to an inquiry. They are noisier than verdicts, and they are the only numbers you can still do something about.
Small teams over-collect verdicts because verdicts are what the bank account shows. The fix is pairing. If revenue is the goal, the pipeline created is its early warning. If win rate worries you, watch response speed, one of the few sales inputs with hard evidence behind it: a 2011 Harvard Business Review study that audited 2,241 US companies found firms contacting a web lead within an hour were nearly seven times as likely to qualify it as firms that waited even an hour longer, and more than 60 times as likely as firms that took a day.
Six sales KPIs that earn their place on a small team
Win rate
Deals won, divided by all deals that reached a decision, won plus lost. Work 20 deals to a verdict and win five, and your win rate is 25%. It feeds two decisions: how much pipeline to hold, which the coverage section below turns into arithmetic, and whether your losses deserve a closer look. One warning. Published win rate benchmarks disagree with each other so thoroughly, 15% to 35% depending on who is counting, that I would ignore them and watch your own trend instead.
Average deal size
Revenue won divided by deals won. Watch the drift more than the level. A slow slide usually means discounting has become a habit. A slow climb can mean you are ready to raise prices. Deal size also sets the arithmetic for everything else: a $240,000 target at $2,500 a deal is 96 deals, and 96 deals is a very different year from 12.
Sales cycle length
Average days from opportunity created to deal closed. Movement matters more than the level here, too; cycles stretch when you are talking to the wrong buyers or when follow-up depends on memory. The level does one job well, though. A 60-day cycle means March revenue gets built in January.
Pipeline coverage
Open pipeline value divided by the revenue target left in the period. The usual rule says to hold 3x your target in the pipeline, and that rule quietly assumes you win about a third of what you work on. Derive your own instead: coverage needed is roughly one divided by win rate, so a 25% win rate calls for about 4x.
Lead response time
Minutes or hours from a new inquiry to your first reply. The HBR finding above turns this from a courtesy into a KPI, and for most small businesses, it is the cheapest number on the list to improve, because you fix it with the leads and people you already have.
New pipeline created
The number of opportunities opened per week. This is the purest leading indicator in the set and the one to check on Friday afternoon. A quiet week here is invisible in this month's revenue and obvious in next quarter's.
One number ties the first four together if you want it: sales velocity, which is open opportunities times win rate times average deal size, divided by sales cycle length. It estimates daily revenue and shows which dial moves it the fastest. Two additions are legitimate when the business calls for them: customer acquisition cost if you buy advertising, and repeat purchase rate if revenue depends on customers coming back. Past that, resist.
Turning a revenue goal into KPI targets
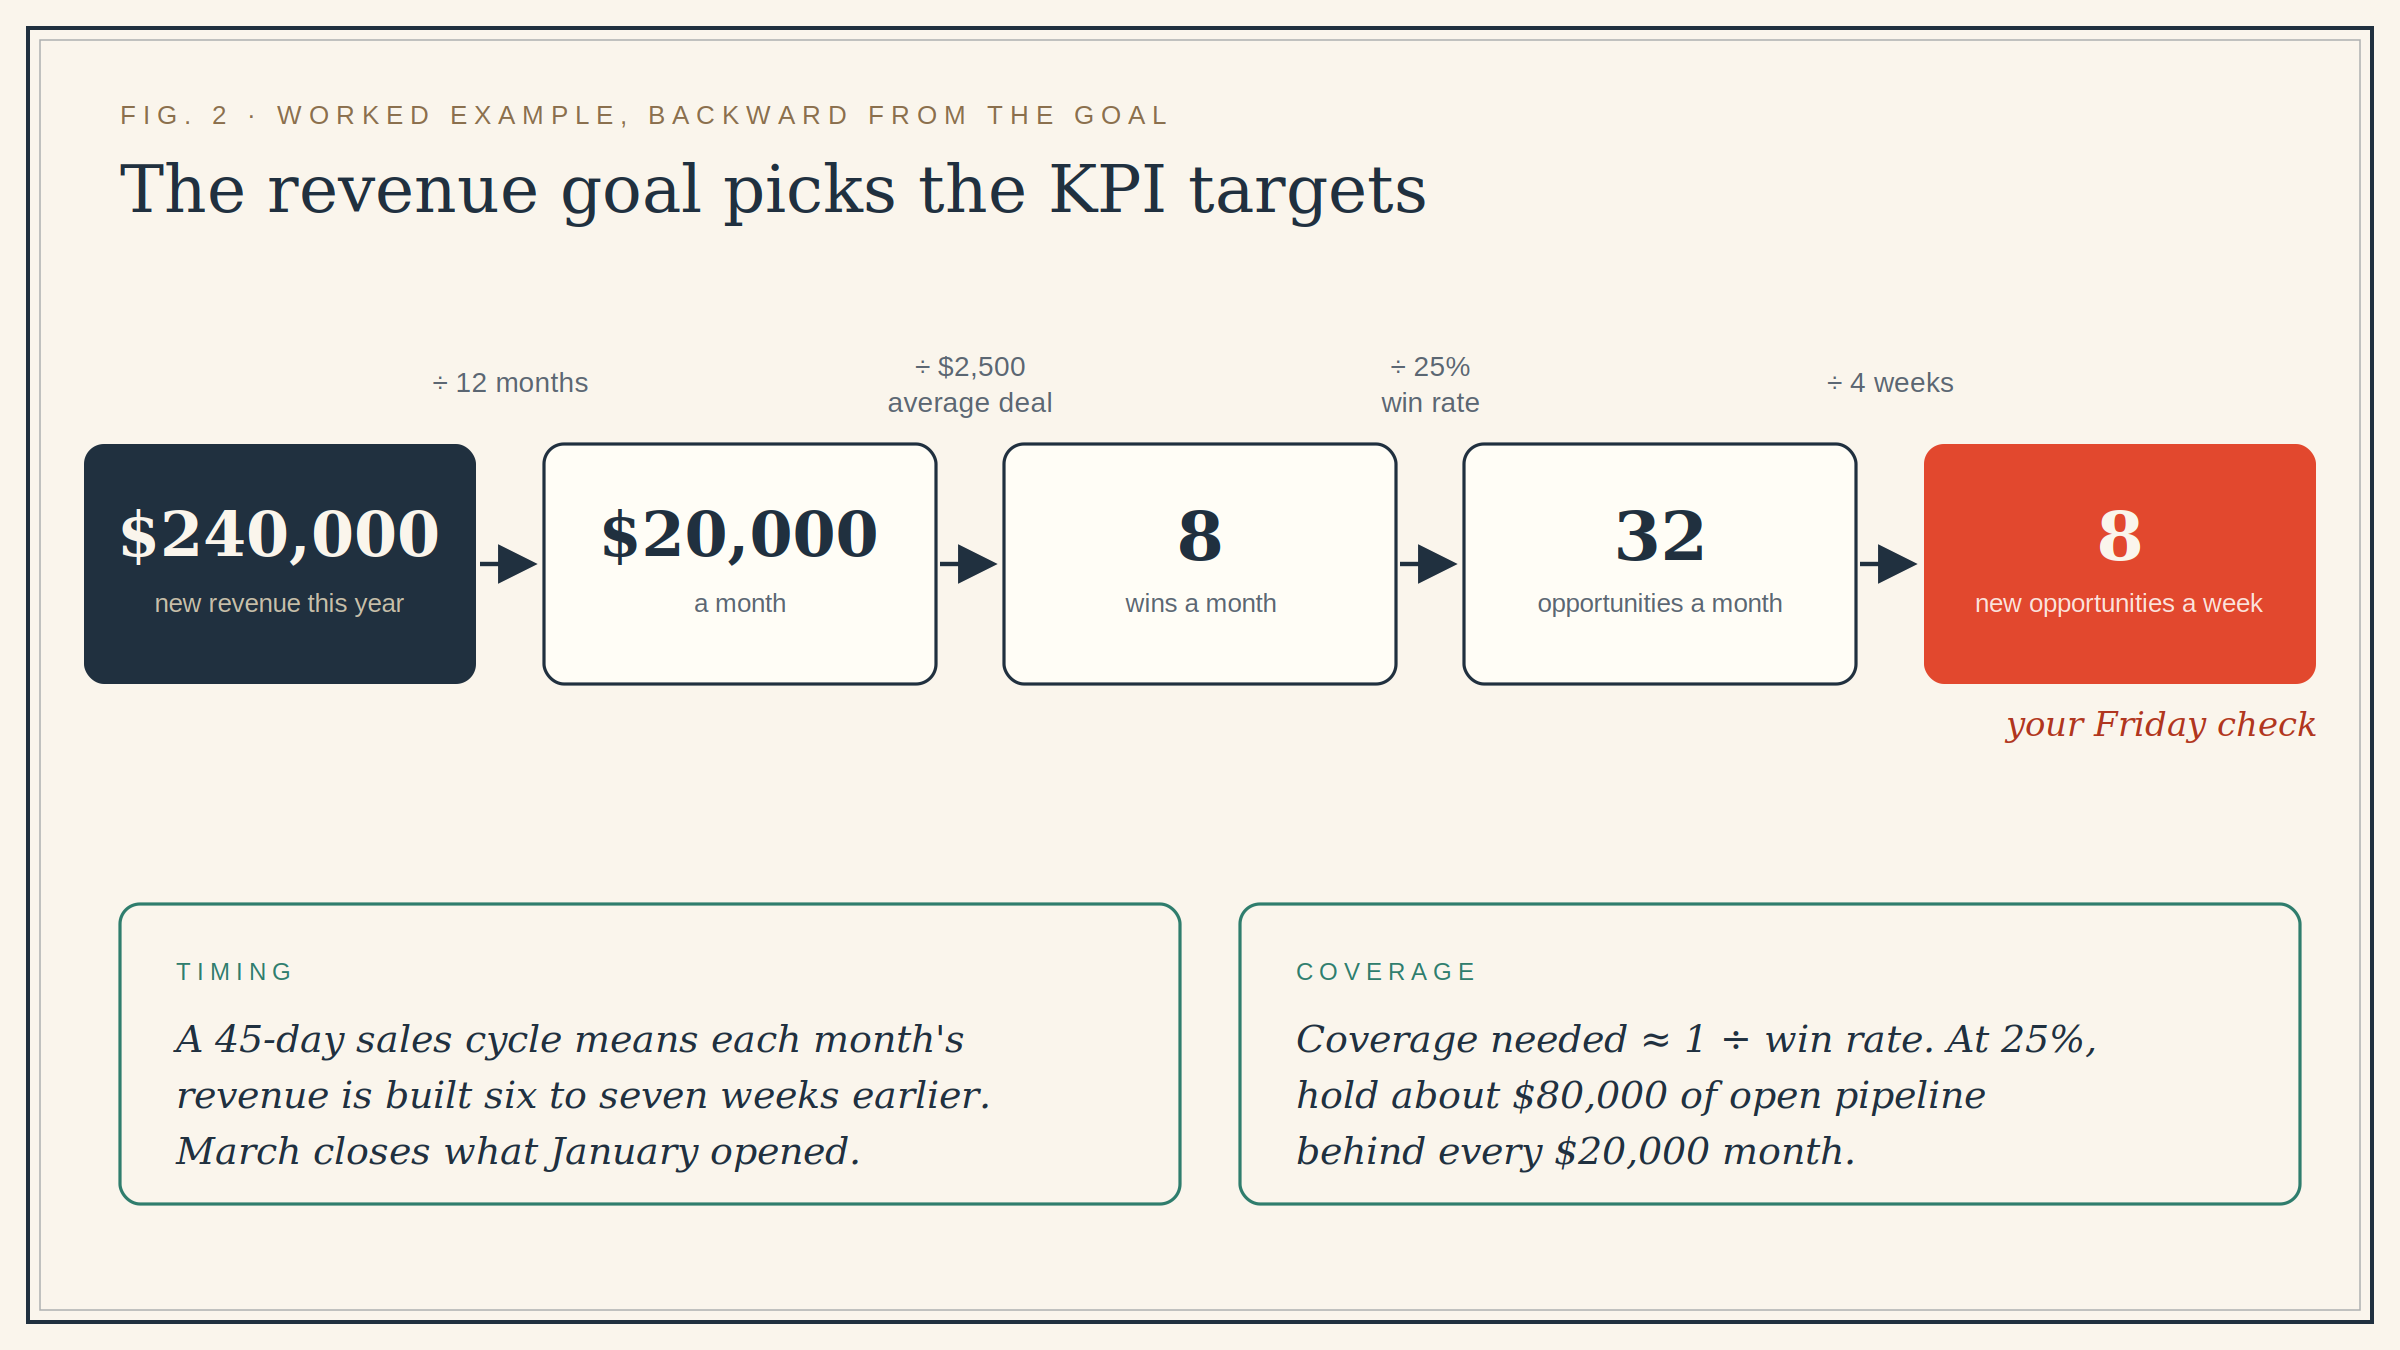
Working backward from the goal is where the term stops being glossary material and starts running your week. Say the goal is $240,000 in new revenue this year, at $20,000 per month. At a $2,500 average deal, that is 8 wins a month. At a 25% win rate, eight wins take 32 opportunities a month, call it eight new ones a week. A 45-day cycle means each month's revenue is built six to seven weeks earlier. And at that win rate, you want about $80,000 of open pipeline standing behind every $20,000 month.
Notice what happened. The revenue goal picked the KPI targets on its own. Eight new opportunities a week is now a leading KPI with a number attached, and checking it takes a minute on Friday. This reverse arithmetic is what KPI means in sales once it leaves the glossary: a goal, decomposed into dials you can turn this week. When a dial misses three weeks straight, you have found the problem months before the revenue line would have confessed.
How many KPIs should a sales team track
Five to seven. I have not seen a team of fewer than 10 people that needed more. Give each number an owner and a rhythm: leading indicators get a weekly look, lagging ones a monthly one. Revisit the set quarterly, because a KPI that changes every month is a mood. Twenty-line dashboards fail for a dull reason: nobody can say which number decides anything.
Sales enablement KPIs, and when they matter
Search "sales enablement KPIs" and you land in enterprise territory. These KPIs measure whether the training, content, and coaching you give sellers make them measurably better: new-hire ramp time, training completion rates, content usage, and time to first deal. Useful numbers, resting on an assumption: that an enablement team exists to be measured.
A small business can borrow two. Time to first deal for a new hire tells you whether your onboarding works or whether new people learn the job by standing near it. And if you maintain a proposal template or a one-pager, whether prospects open the thing tells you whether it earns its upkeep. The other twelve can wait until you have a sales manager.
Mistakes that turn KPIs into wallpaper
The commonest failure is volume. Fifteen numbers on a dashboard is a way of tracking nothing. The second is collecting only verdicts, covered above.
The sharpest trap has a name. Goodhart's law, after the British economist Charles Goodhart, says that when a measure becomes a target, it stops being a good measure. Pay people on call volume, and you will get more calls, each one shorter. KPIs are for diagnosis. Pay and quotas are for motivation, and the two jobs should never share a number because people will manage the number rather than the customer.
Two smaller ones. Vanity metrics that can only rise, total contacts and cumulative pipeline among them, tell you nothing because they cannot fall. And a KPI spreadsheet updated the night before the review measures memory, and memory is generous.
Where the numbers should live
A KPI you compute by hand once a month is a report wearing the wrong name. The definitions above lean on timestamps: when an opportunity opened, when it changed stage, when it closed, and how fast the first reply went out. Spreadsheets forget those, which is the honest reason CRMs appear in every article on this subject, including this one.
A disclosure before the pitch: Bigin is our product. It is a pipeline-first CRM built for small businesses. Deals move through stages on a board, and its dashboards chart the movement, so win rate, deal size, time in stage, and stage-by-stage drop-off read like gauges instead of homework. The free plan covers one user, one pipeline, and 500 records; paid plans start at $7 per user per month on an annual billing plan, and the pricing stays small-business-shaped all the way up. Those figures were checked against our own pricing page in August 2026, which is the same test you should apply to any vendor's claims, ours included.
The short version
KPI meaning in sales, compressed: the few numbers you have chosen to steer revenue by. A metric earns the title when it predicts money and changes behavior. Six will carry a small team a long way: win rate, average deal size, cycle length, pipeline coverage, lead response time, and new pipeline per week. Set targets by walking backward from the revenue goal, review the leading ones every Friday, and let the software do the counting. Try Bigin free for 15 days, no card required, and see how much of this measures itself.